NPV Function in Excel: Explained
In this article, you will learn how to use the NPV formula in Excel
What does the NPV formula do in Excel?
The NPV (Net Present Value) function in Excel is used to calculate the present value of a series of cash flows. It takes into account the time value of money, meaning that it discounts future cash flows to their present value using a discount rate. This function is helpful in evaluating the potential profitability of an investment or project.
The NPV function is commonly used in financial analysis and decision-making to help determine investment projects' feasibility and potential profitability. It is also often used in capital budgeting to compare the relative value of different investment opportunities.
How to use the NPV function in Excel?
The syntax of the NPV formula in Excel is as follows:
rate: The discount rate used to calculate the present value of the cash flows.
value1, value2, ...: The series of cash flows, with value1 representing the cash flow at the end of period 1, value2 representing the cash flow at the end of period 2, and so on.
The NPV function returns the present value of the cash flows. A positive NPV indicates that the investment is profitable and a negative NPV indicates that the investment is not profitable. The higher the NPV, the more profitable the investment.
Sample use case for the NPV formula in Excel
Suppose you are a financial analyst evaluating a potential investment in a new manufacturing plant for your company. The project will require an initial investment of $1 million, and is expected to generate cash flows of $300,000 per year for the next five years.
To determine whether the investment is worthwhile, you need to calculate the net present value of the project. This involves discounting the future cash flows back to their present value, taking into account the time value of money and the cost of capital.
To perform this analysis in Excel, you would follow these steps:
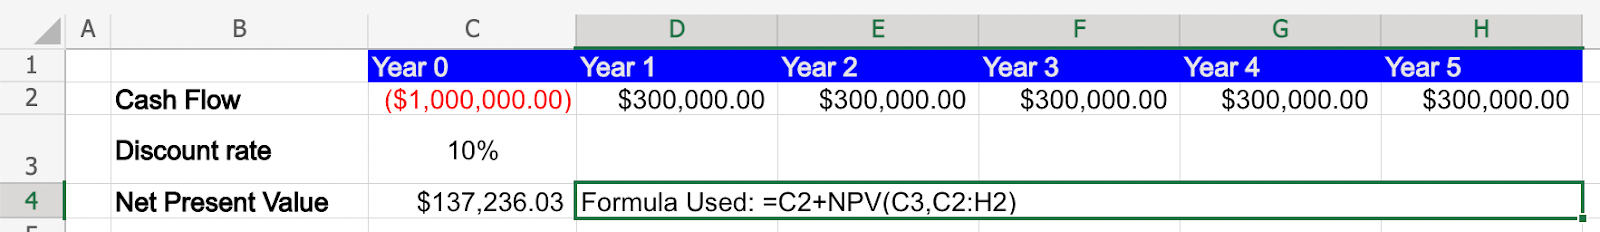
Step 1: Open a new Excel spreadsheet and create a table to list the projected cash flows for each year of the project. In this case, the table would have six columns: Year 0 (initial investment), Year 1, Year 2, Year 3, Year 4, and Year 5.
Step 2: Enter -$1,000,000 in the Year 0 column (to represent the initial investment), and $300,000 in each of the Year 1-5 columns (to represent the projected cash flows).
Step 3: Next you use the NPV function in Excel to perform the Present Value calculation. The formula would be =C2+NPV(10%,D2:H2), where 10% is the discount rate and D2:H2 is the range of cells containing the cash flows for each year. Do note, we have added the initial investment in Year 0 separately as the NPV function takes into account the cashflows from the end of period 1 which is Year 1 in this case.
If the net present value of the project is positive, this indicates that the investment is expected to generate a return that exceeds the cost of capital, and is therefore a worthwhile investment. If the net present value is negative, this indicates that the investment is not expected to generate a sufficient return to justify the cost, and should be reconsidered.