Sensitivity Analysis in Excel: Explained
In this article, you will learn how to perform sensitivity analysis in Excel using Data Tables
What do you mean by Sensitivity Analysis?
Sensitivity analysis is a technique used to understand the relationship between the inputs or assumptions in a model and the resulting outputs or outcomes. It helps identify how changes in input variables impact the overall results.
The goal of sensitivity analysis is to assess the model's sensitivity to different input factors and determine which variables have the most significant influence on the outputs. It aids in understanding the uncertainty and risks associated with a particular model or decision, enabling decision-makers to make informed choices, assess potential scenarios, and identify critical factors that drive the outcomes.
How to perform one-way Sensitivity Analysis in Excel
Performing a one-way sensitivity analysis in Excel involves changing one input variable or assumption while keeping all other variables constant to understand its impact on the output or results.
Suppose you are a financial analyst evaluating an investment project for a company. The project is expected to generate free cash flows over a period of five years. By using a data table, you can discount these cash flows at different rates (One-way sensitivity) and assess the project's NPV under various scenarios.
Assumptions:
Initial Investment: $575,000.
Cash Flows: $150,000 for five years.
Discount Rates: We will analyze the project's NPV using discount rates ranging from 8% to 12%.
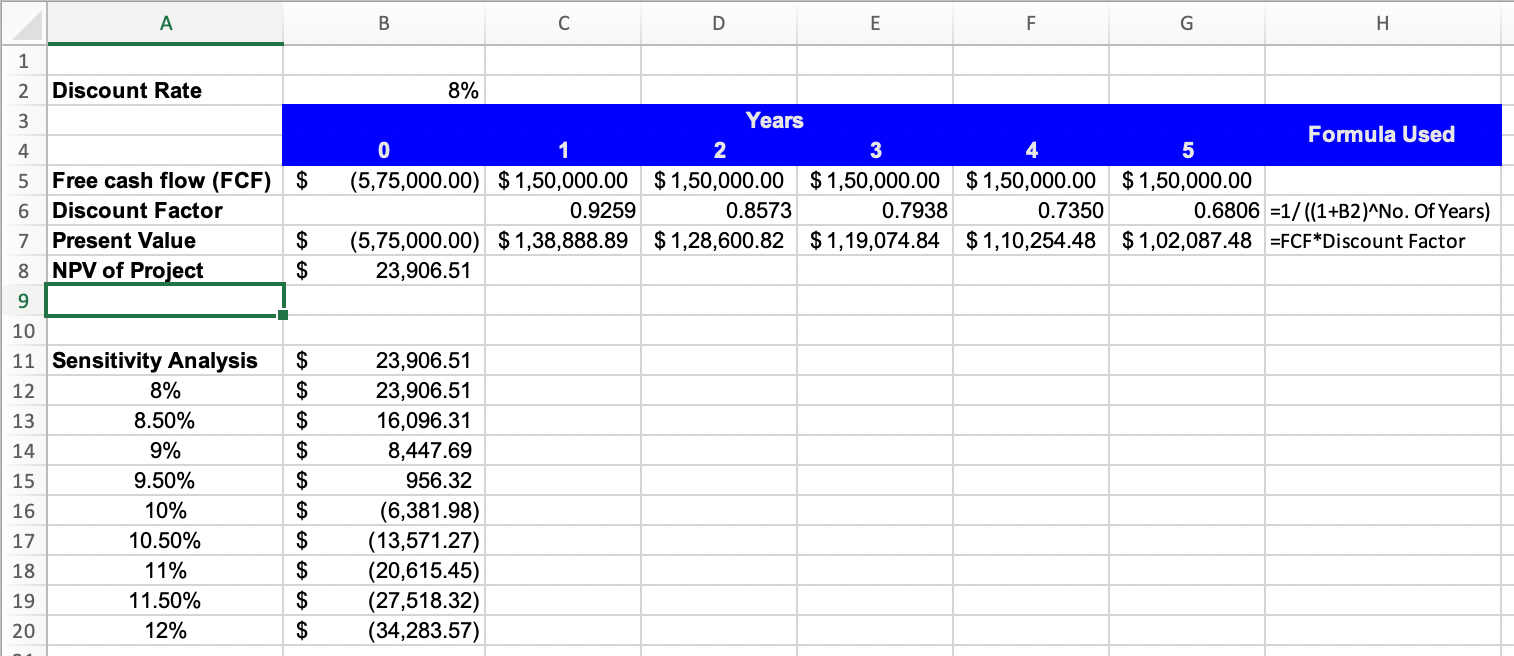
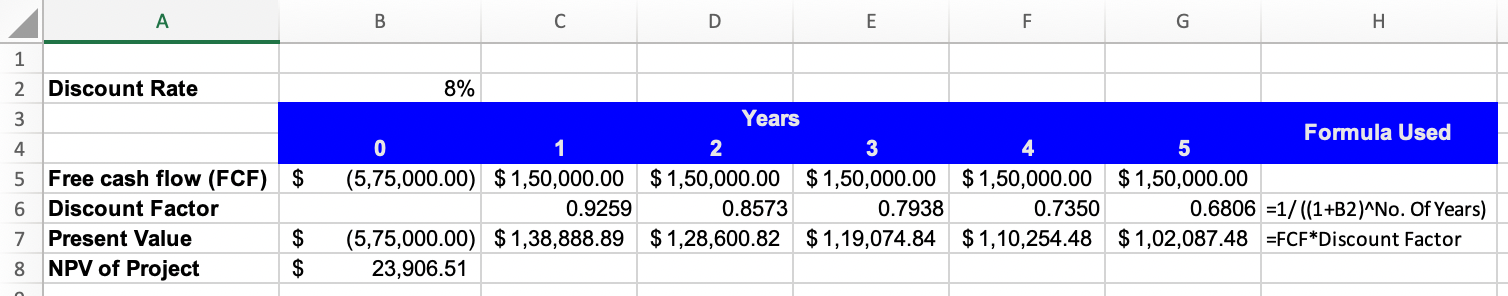
Step 1: Set up your Excel spreadsheet with the necessary calculations to calculate the NPV of the Project with 8% discount rate
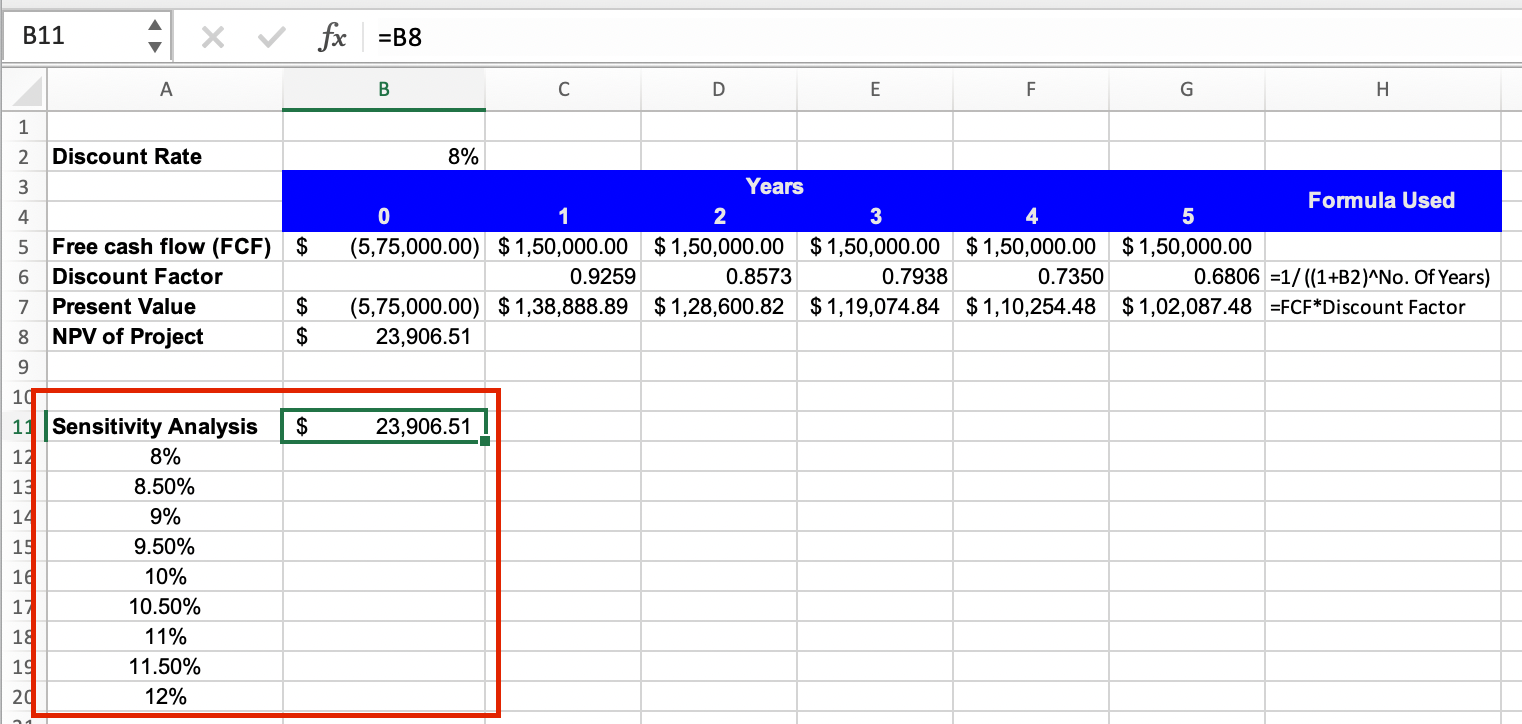
Step 2: Create a column in your spreadsheet to represent the range of values for the variable you want to vary, in this case discount rate between 8%-12%. In the next column header enter the formula that calculates the result you are interested in i.e. enter “=B8” in cell B11
Step 3: Now select the range of the data table, including both the input values and the formula cell which is A11:B20 in this case.
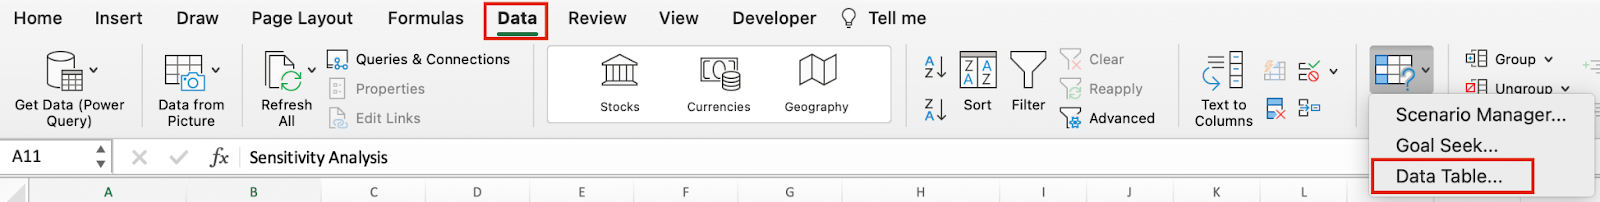
Step 4: From the Excel menu, go to the "Data" tab and click on "What-If Analysis" Then, select "Data Table."
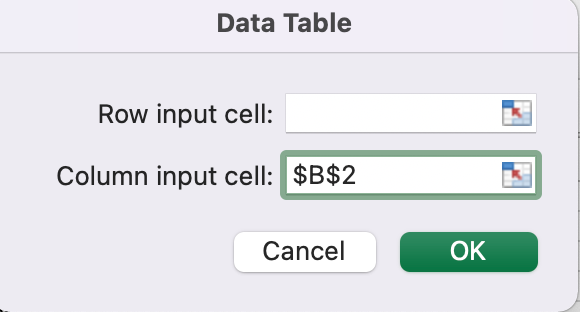
Step 5: In the Data Table dialog box, enter the cell reference of the input values. Click in the "Column Input Cell" box if your input values are in a column, or click in the "Row Input Cell" box if your input values are in a row. Enter the reference to the cell that contains the value you want to substitute in the formula which is the interest rate in cell B2. Click "OK" to apply the data table.
By following these steps, you can perform a one-way sensitivity analysis in Excel, allowing you to assess the impact of varying an input variable on the desired output or results.