PERCENTILE Function in Excel: Explained
In this article, you will learn how to use the PERCENTILE formula in Excel.
How does the PERCENTILE formula work in Excel?
The PERCENTILE function in Excel calculates the k-th percentile for a range of values. The k-th percentile is the value below which k percent of the data falls.
When should you use the PERCENTILE function in Excel?
The PERCENTILE function in Excel is proper when you need to analyze a large set of numerical data and want to find a specific percentile value within that data set. This function can help you identify the value below which a certain percentage of the data falls. Here are some examples of when you might want to use the PERCENTILE function:
- Analyzing profit margins by client: Suppose you have a large data set about revenue and profit by the client and want to know the margin that falls below the 90th percentile.
- Calculating sales targets: If you want to set sales targets based on previous sales performance, you can use the PERCENTILE function to determine the sales level below a certain percentile, such as the 75th percentile.
- Measuring employee performance: If you have a data set of employee performance metrics, you can use the PERCENTILE function to determine the performance level below which a certain percentage of employees fall, such as the 50th percentile.
How to use the PERCENTILE formula in Excel
The formula for the PERCENTILE function is as follows:
where "array" is the range of cells containing the dataset, and "k" is the percentile value you want to calculate, which must be between 0 and 1. So, if you want to get the number corresponding to the 50th percentile, you should substitute k with 0.5 in the formula.
Note 1: If you insert a non-numeric value in the “k” argument, the function returns #VALUE! error.
Note 2: If you insert a number below 0 (exclusive) or above 1 (again, exclusive), the formula gives you #NUM! error.
Note 3: If k is not a multiple of 1/(n-1), where n is the total number of items selected, the PERCENTILE function interpolates to decide the number at the k-th percentile. (You can see this happens in the example below)
For example, suppose you have a client list containing revenue, profit, and profit margin and want to know what margin corresponds to a particular percentile given the data set.
- Insert the PERCENTILE formula: =PERCENTILE(
- Select the range containing the data you want to analyze for “array”
- Enter the “k” argument by cell reference or manually
The following picture shows what the 90th, 70th, 50th, 20th, and 10th percentile look like with the sample dataset. We recommend using a cell reference for the “k” argument, as it allows you to change the argument quickly and easily.

What is the difference between percentage and percentile?
Percentage and percentile are two terms often used in statistical analysis, but they have different meanings. A percentage is a way of expressing a number as a fraction of 100. It is often used to represent proportions, rates, and percentages of change. For example, if you have 80 correct answers out of 100 questions on a test, you have scored 80%, which means you got 80% of the total possible score. On the other hand, a percentile is a statistical measure that represents the percentage of data values that fall below a specific value in a data set. For example, if your score on a test is at the 80th percentile, it means that 80% of the test-takers scored below your score. The PERCENTILE formula helps you find a number positioned at the k-th percentile based on your input data.
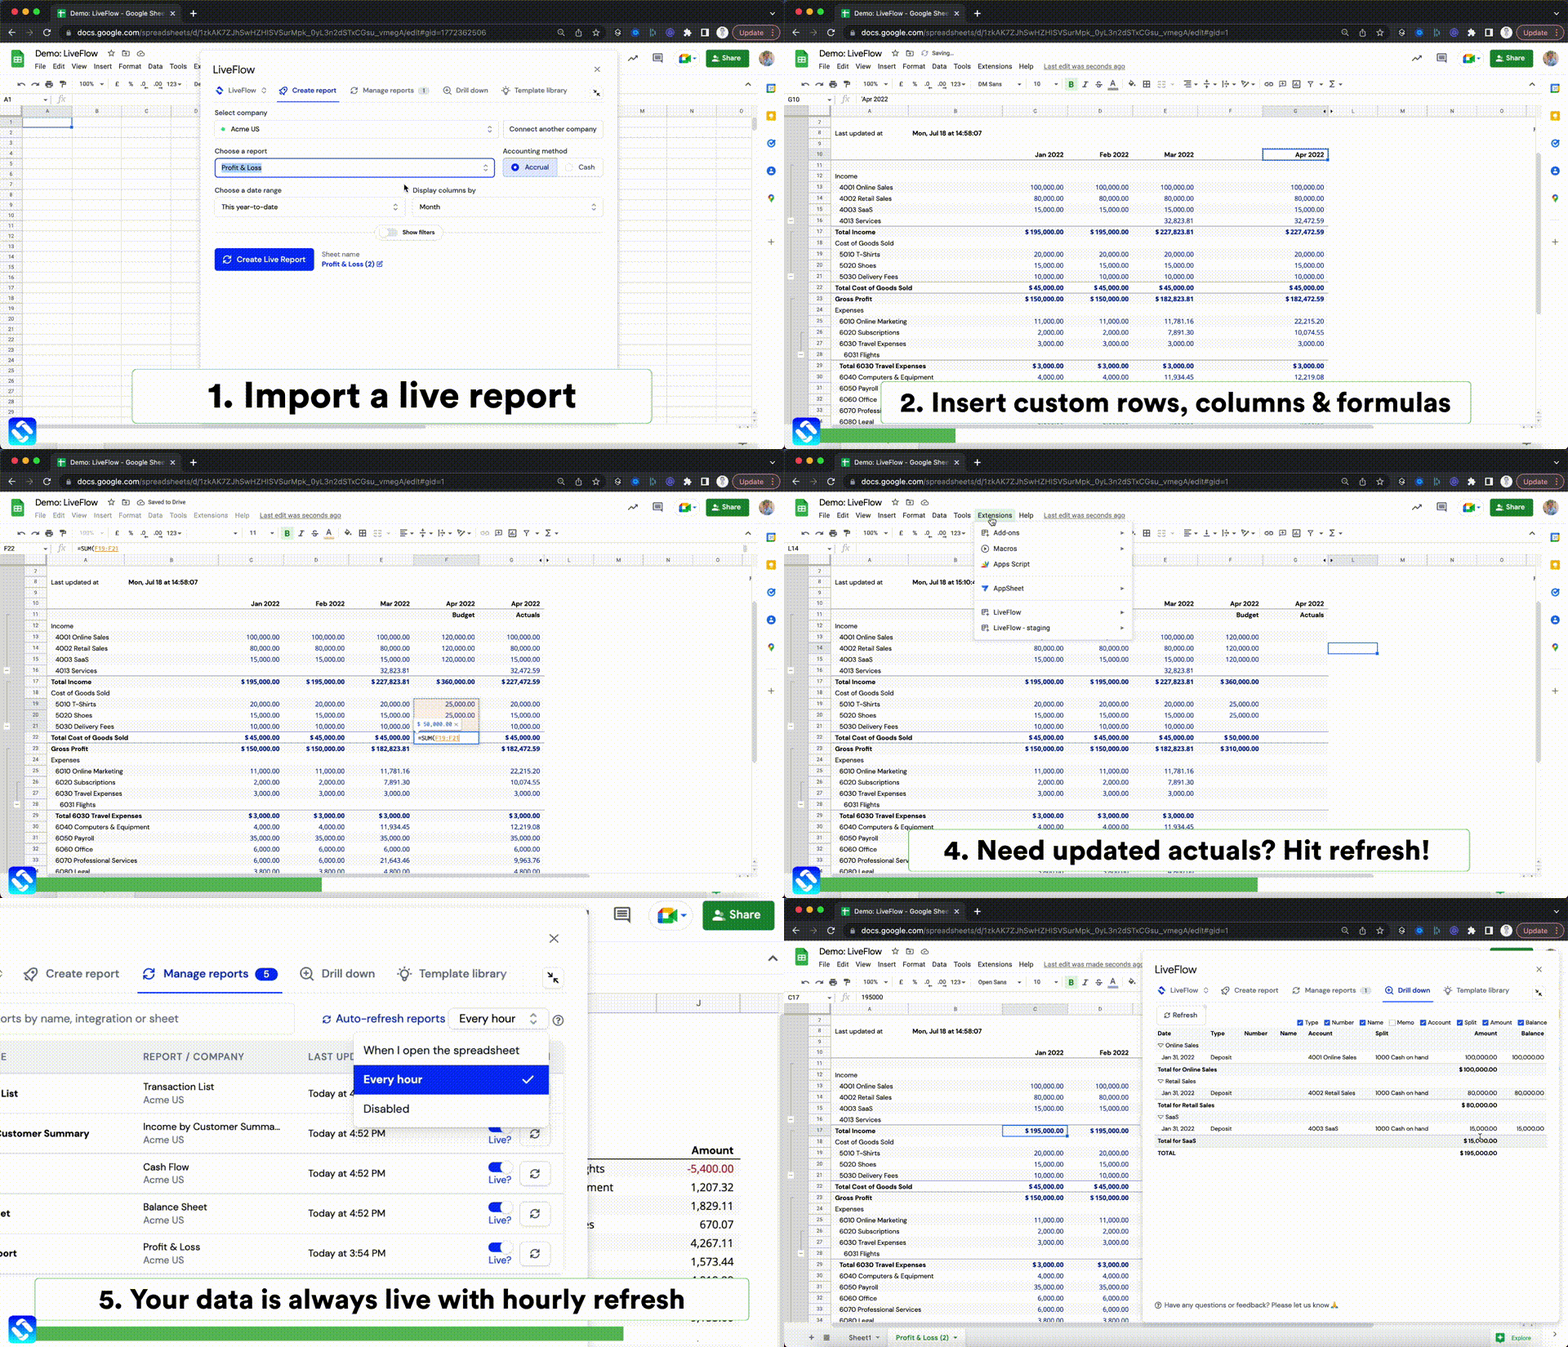
Analyze your live financial data in a snap in Google Sheets
Are you learning this formula to visualize financial data, build a financial model, or conduct financial analysis? In that case, LiveFlow may help you automate manual workflows, update numbers in real-time, and save time. You can access various financial templates on our website, from the simple Income Statement to Multi-Currency Consolidated Financial Statement. Are you interested in this product but are an Excel user? That’s not a problem at all. You can connect Google Sheets to Excel quickly.
To learn more about LiveFlow, book a demo.

You can learn about other Excel and Google Sheets formulas and tips that are not mentioned here on this page: LiveFlow‘s How to Guides

