How to Split Text into Columns in Excel?
In this article you will learn how to separate text into columns in Excel
What does Text into Columns feature in excel do?
The "Text to Columns" feature in Excel allows you to separate data in a cell or range of cells into multiple columns based on a delimiter or a fixed width.
What are the uses of Text into Columns in Excel?
In Excel, splitting text into columns can be useful for various purposes, including:
- Data organization: When you have a large dataset with text that needs to be organized into separate categories, you can split the text into columns to create a structured and organized dataset.
- Data analysis: Splitting text into columns can help you analyze data more effectively by allowing you to sort and filter data according to specific criteria.
- Data transformation: Splitting text into columns can be used to transform data from one format to another. For example, you might use it to convert a long list of names and addresses into separate columns for first name, last name, street address, city, state, and zip code.
- Data merging: You can also use text splitting to merge data from different sources. For example, you might have two sets of data with different fields, but with a common identifier. Splitting the data into columns and merging them based on the identifier can help you create a unified dataset.
Overall, splitting text into columns in Excel can be a powerful tool for managing and analyzing data in a wide range of applications.
How to split text into columns in Excel?
To use the "Text to Columns" feature in Excel, follow these steps:
Step 1: Open the Excel file and select the column that you want to split into multiple columns.
Step 2: Click on the "Data" tab in the Excel ribbon.
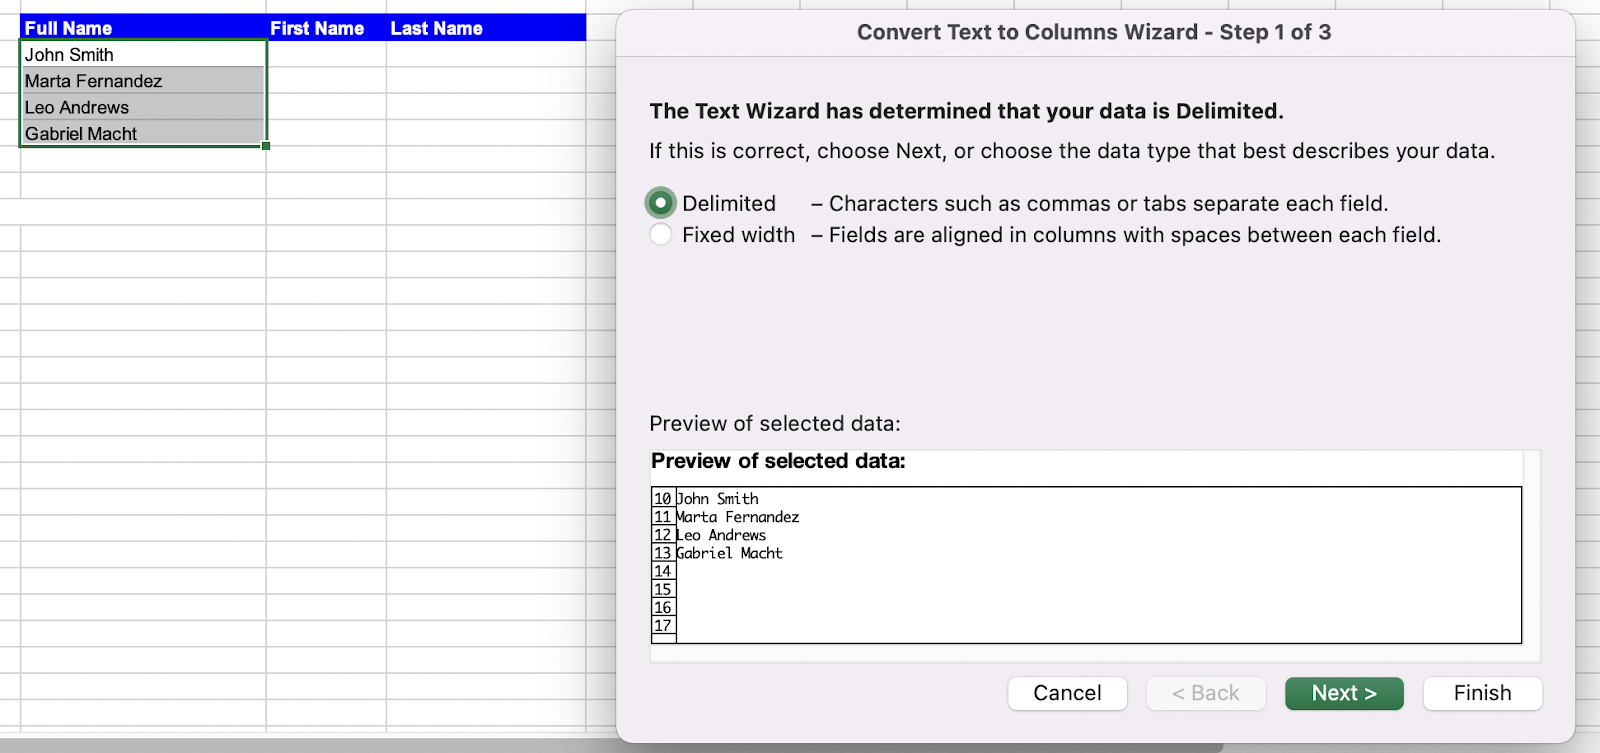
Step 3: Click on the "Text to Columns" button. This will open the "Convert Text to Columns Wizard" dialog box. Here you will see two ways to split the data - “Delimited” & “Fixed Width”

Step 4: In the first step of the wizard, choose the "Delimited" option if your data is separated by a specific character, such as a comma or a tab, or choose the "Fixed Width" option if your data has a specific column width.

Step 5: If you chose the "Delimited" option, select the delimiter that separates your data. You can choose from a list of pre-defined delimiters, or you can specify a custom delimiter.

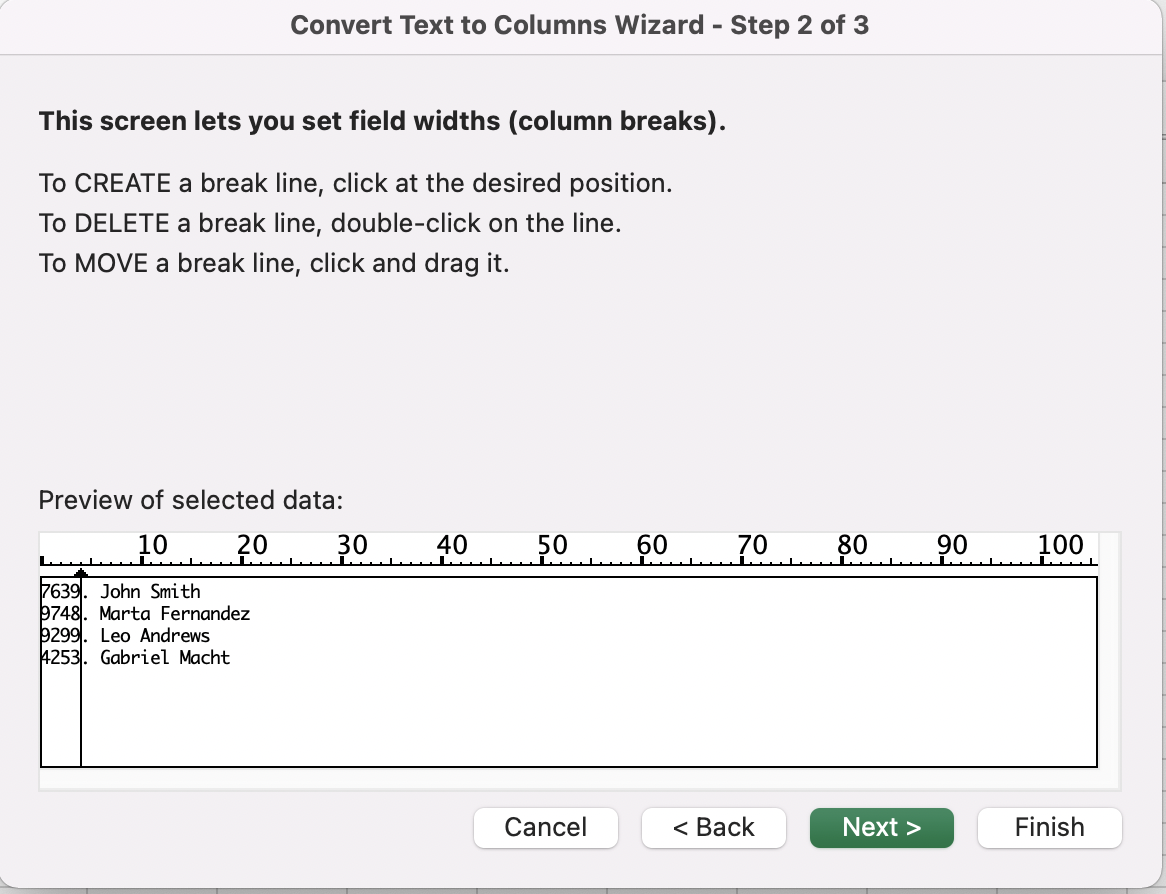
Step 6: If you chose the "Fixed Width" option, click and drag the vertical lines in the preview pane to define where you want to split your data.

Step 7: Click the "Next" button to proceed to the next step of the wizard.
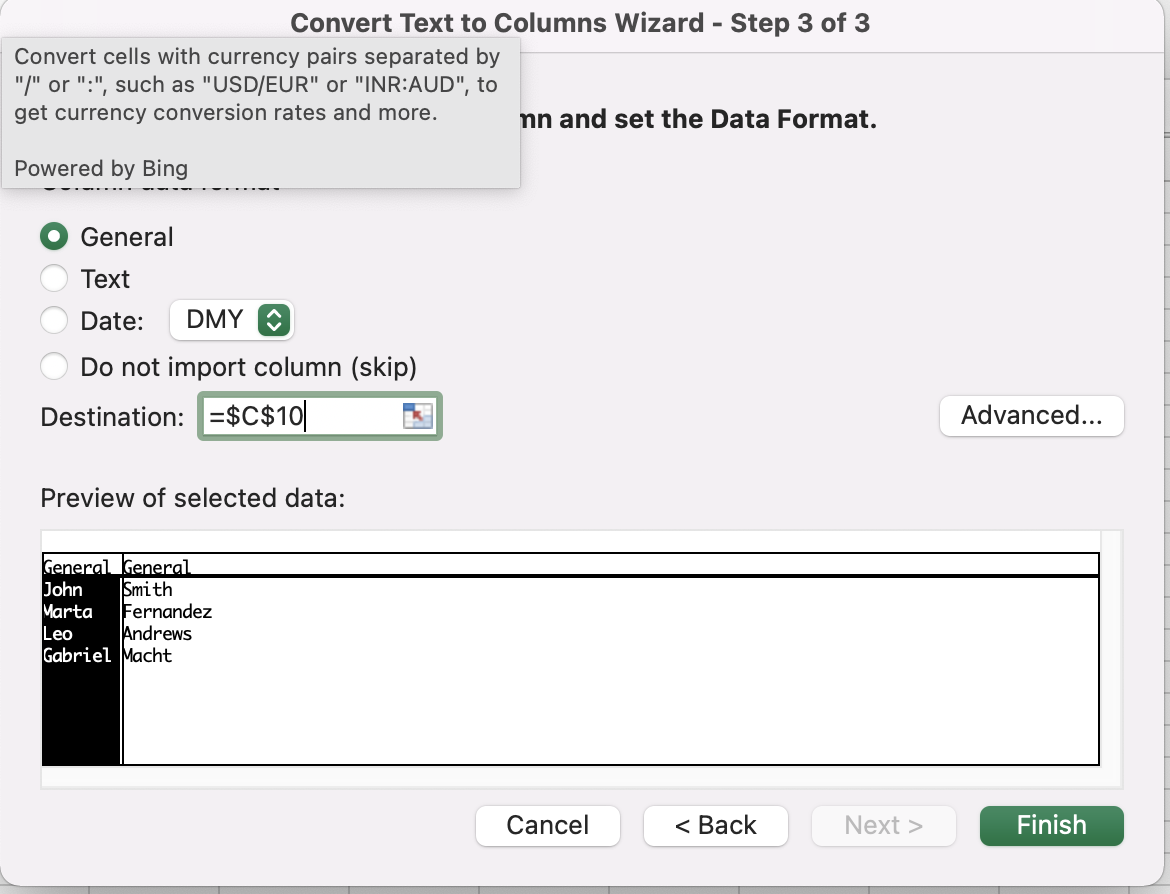
In the second step of the wizard, choose the data format for each column that you are splitting your data into.

Step 8: Click the "Finish" button to complete the wizard and split your data into multiple columns.
After completing these steps, Excel will split the selected column into multiple columns based on the settings that you specified in the wizard.
Analyze your live financial data in a snap in Google Sheets
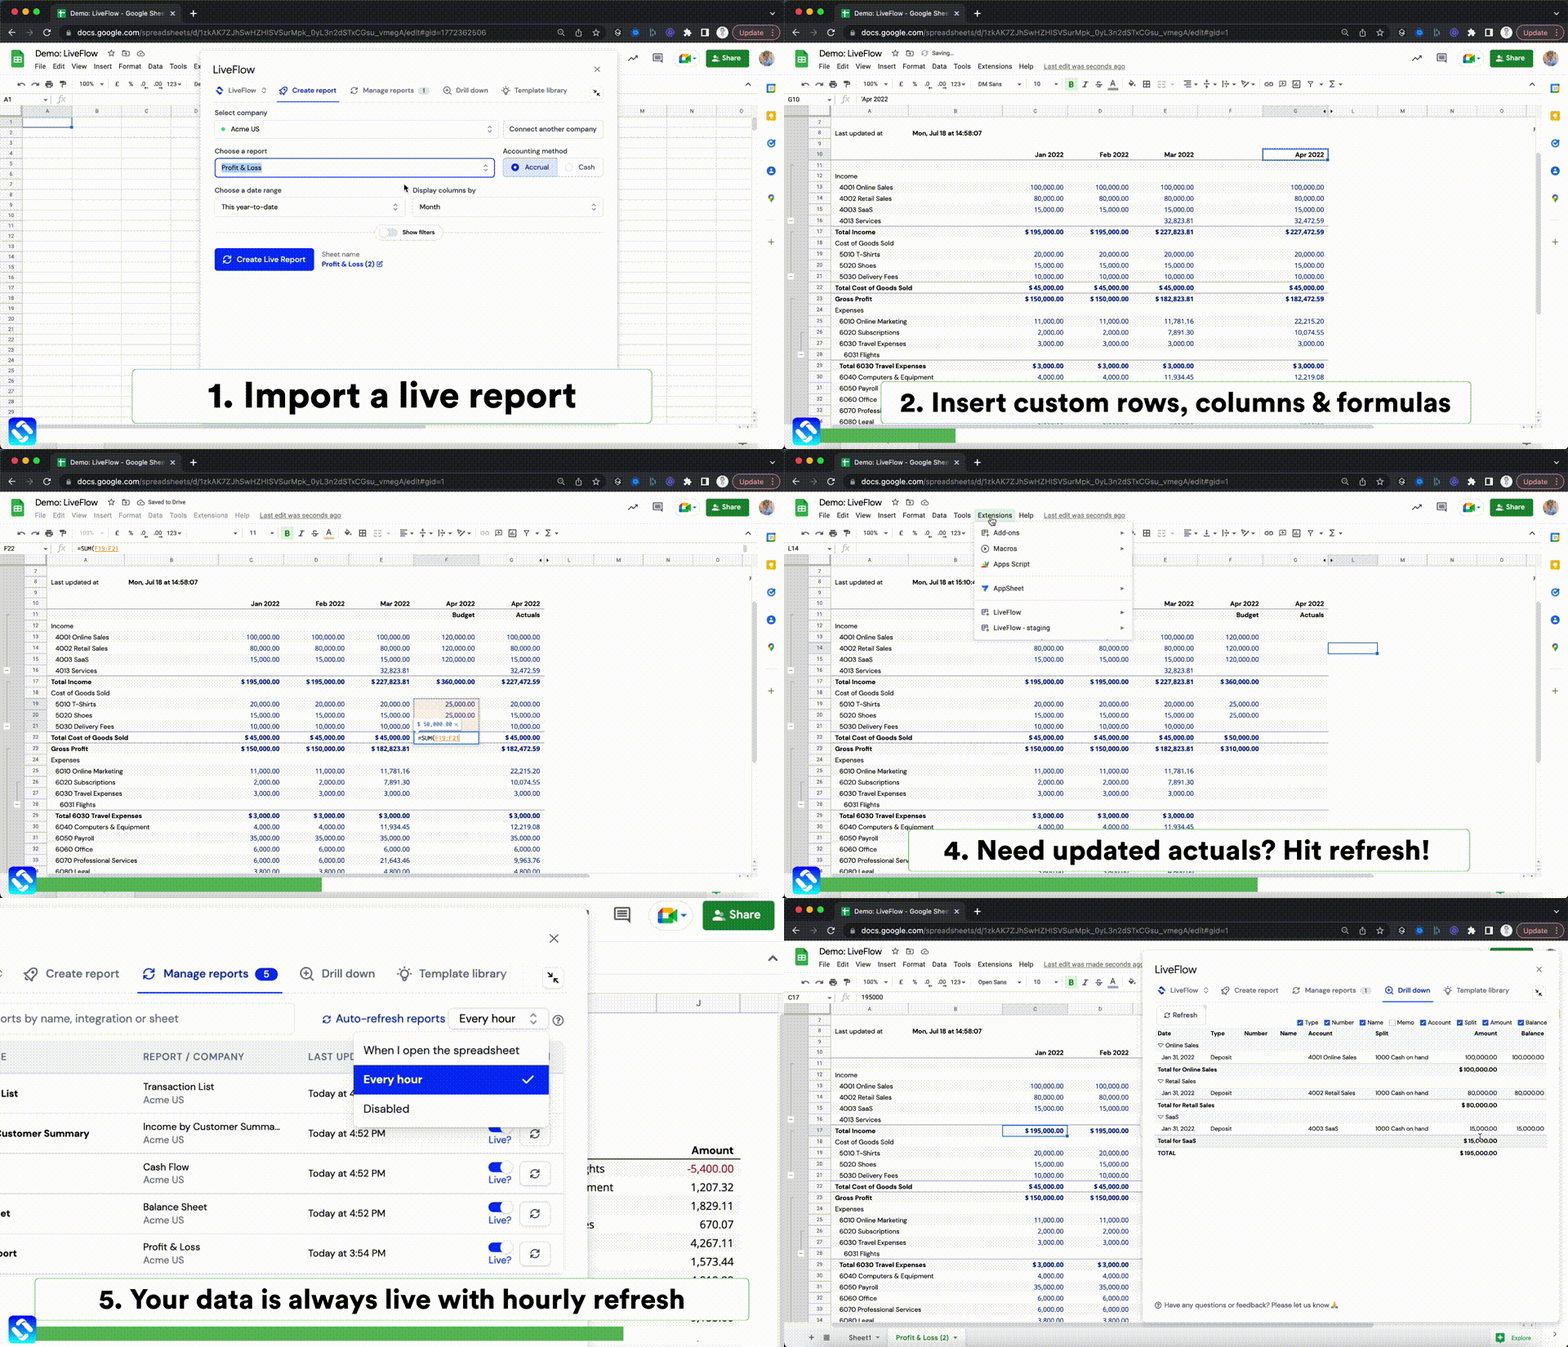
Are you learning this formula to visualize financial data, build a financial model, or conduct financial analysis? In that case, LiveFlow may help you automate manual workflows, update numbers in real-time, and save time. You can access various financial templates on our website, from the simple Income Statement to Multi-Currency Consolidated Financial Statement. Are you interested in this product but are an Excel user? That’s not a problem at all. You can connect Google Sheets to Excel quickly.
To learn more about LiveFlow, book a demo.

You can learn about other Excel and Google Sheets formulas and tips that are not mentioned here on this page: LiveFlow‘s How to Guides

